Queues report
The report contains information about the received missed and transferred calls for each queue, their total duration and average duration of one call, the time of dial and hold for the reporting period.
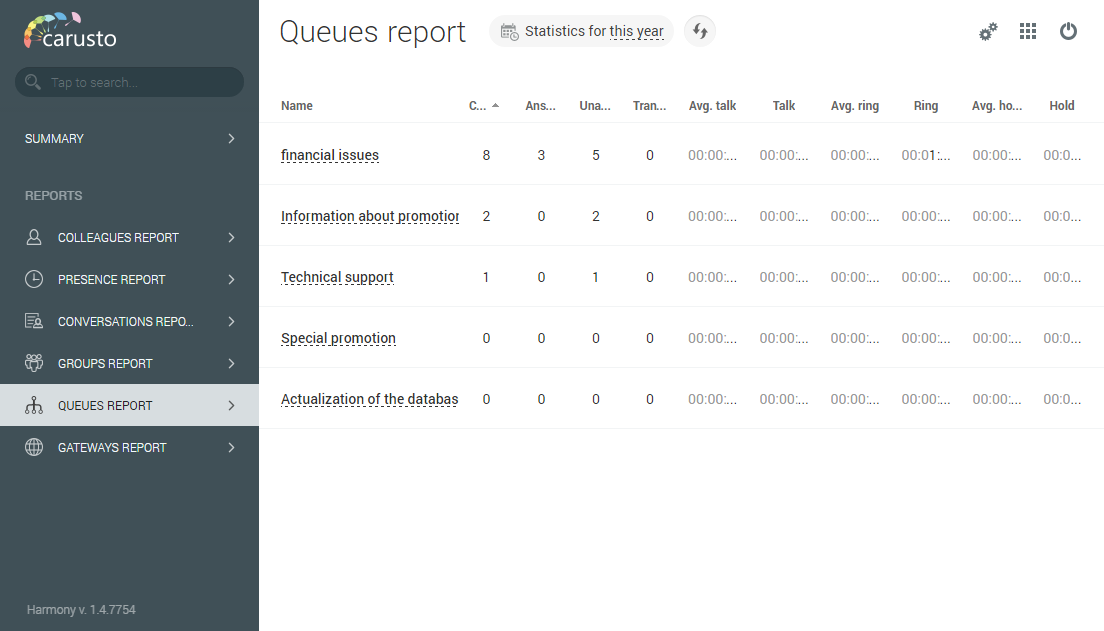
You can set the required period in the top line of the window. Select a period from the list or set it by choosing "custom" option. Click on the name of the queue to go to the queue report.
This report contains information about answered, missed, transferred calls, as well as about the calls dropped and hanged up by the operator, the average time of dialing, holding and talking and the total time of all calls. You can see on the graph how many calls fall to the particular time interval.
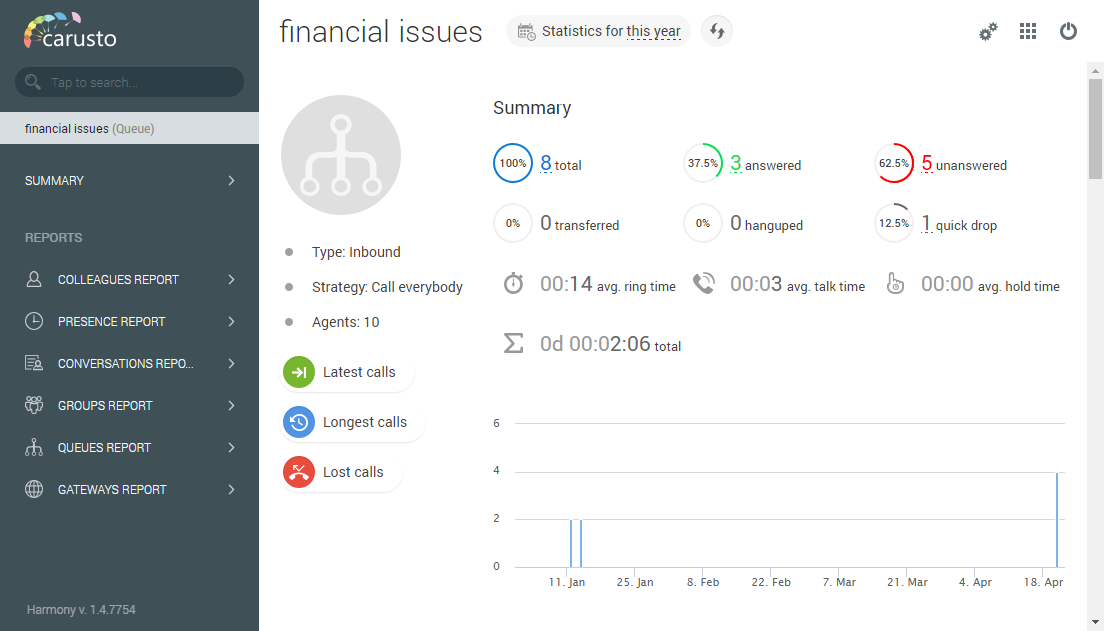
Left-click on the graph to open the detailed calls report.
Service level
This index can be calculated by several different formulas:
-total calls answered within the time threshold/total answered and abandoned calls.
-total calls answered and abandoned within the time threshold/total answered and abandoned calls.
-total calls answered within the time threshold/total answered calls and calls abandoned after the time threshold.
-total calls answered within the time threshold and abandoned before the time threshold expired/total answered and abandoned calls.
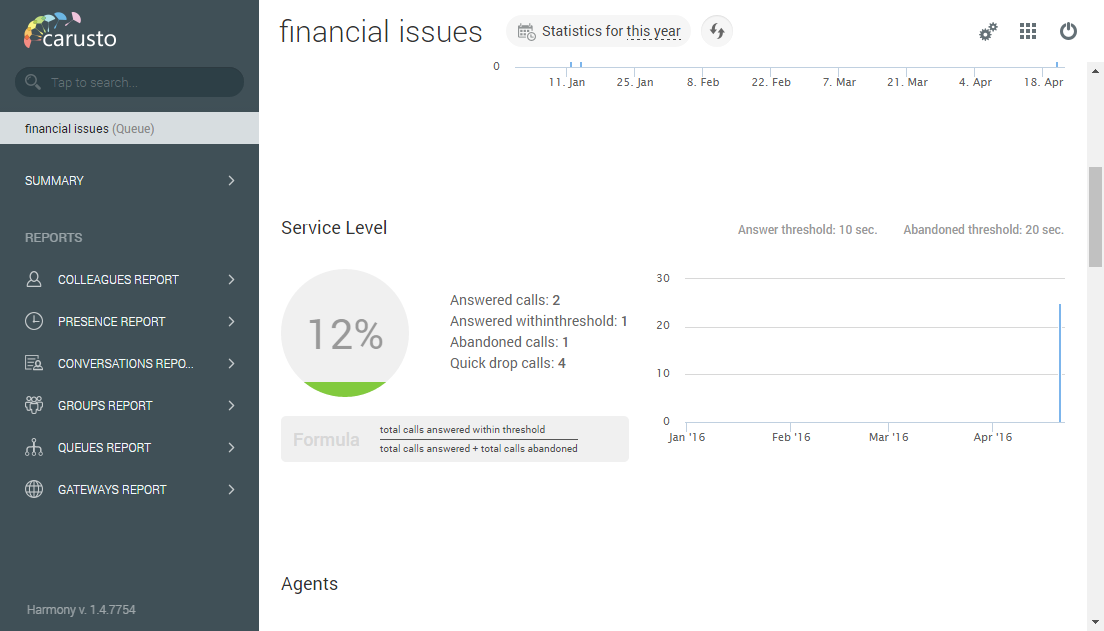
The formula for calculating the service level and time thresholds are set in the call center menu in the corresponding queue.
Queue agents report
This report displays information about answered, missed, transferred calls, as well as about the calls, hanged up by the queue agents, total and average time of dial, hold and conversations on this calls.
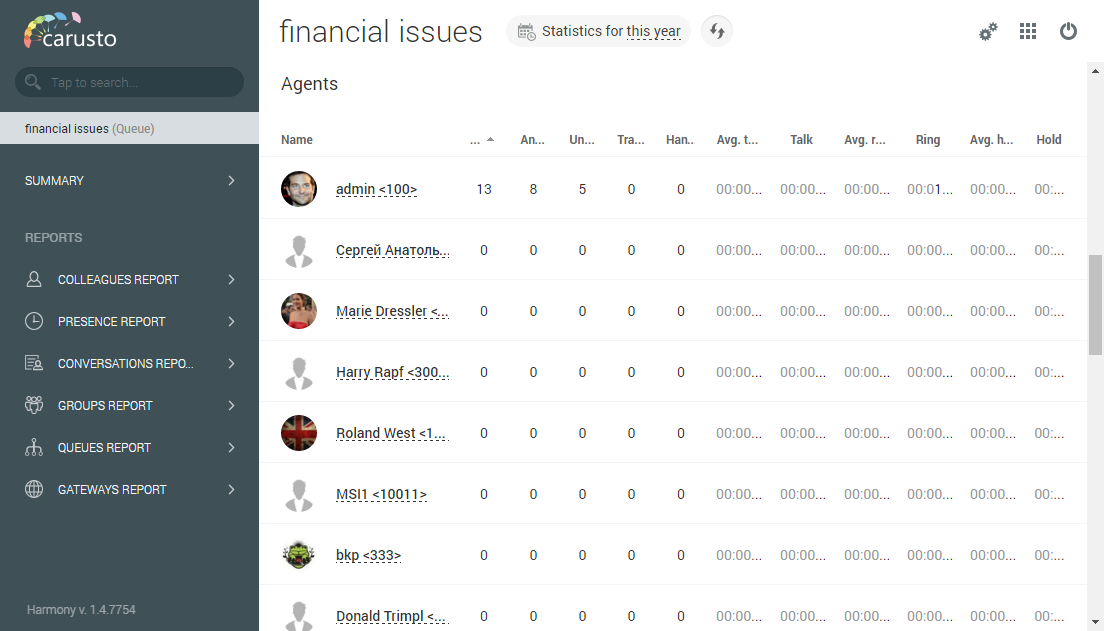
Clicking on the agent's name opens a detailed report on the selected employee.
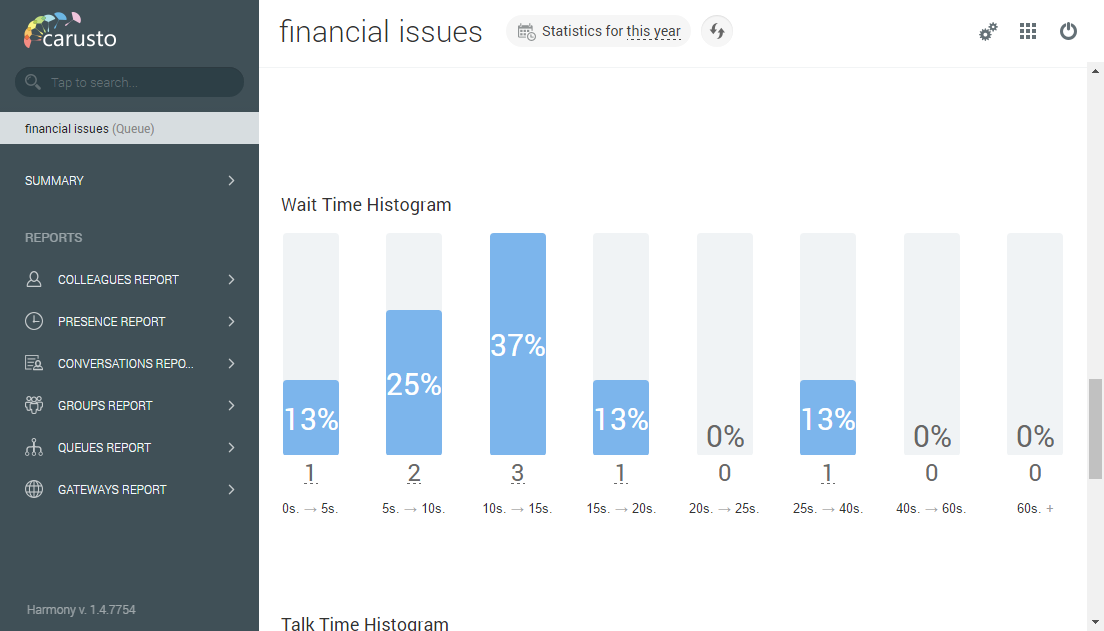
Wait Time Histogram displays the response rate of the queue agent for the call in percentage with breakdown by intervals.
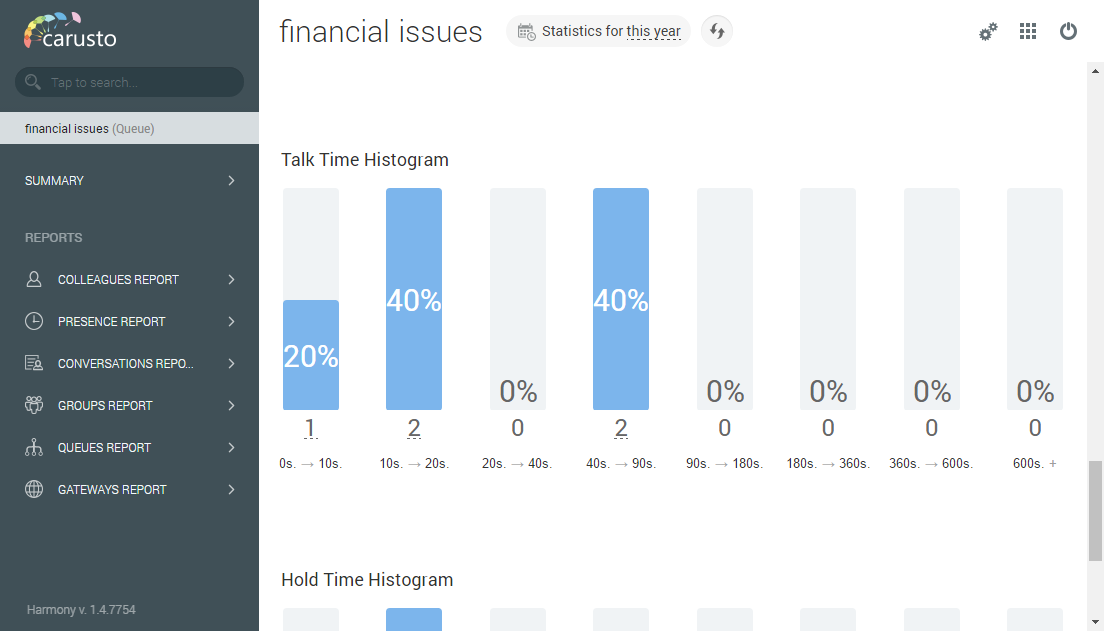
Talk Time Histogram displays the percentage of calls by their duration, with breakdown by time intervals.
Hold Time Histogram displays the duration of the call on hold in percentage with breakdown by intervals.
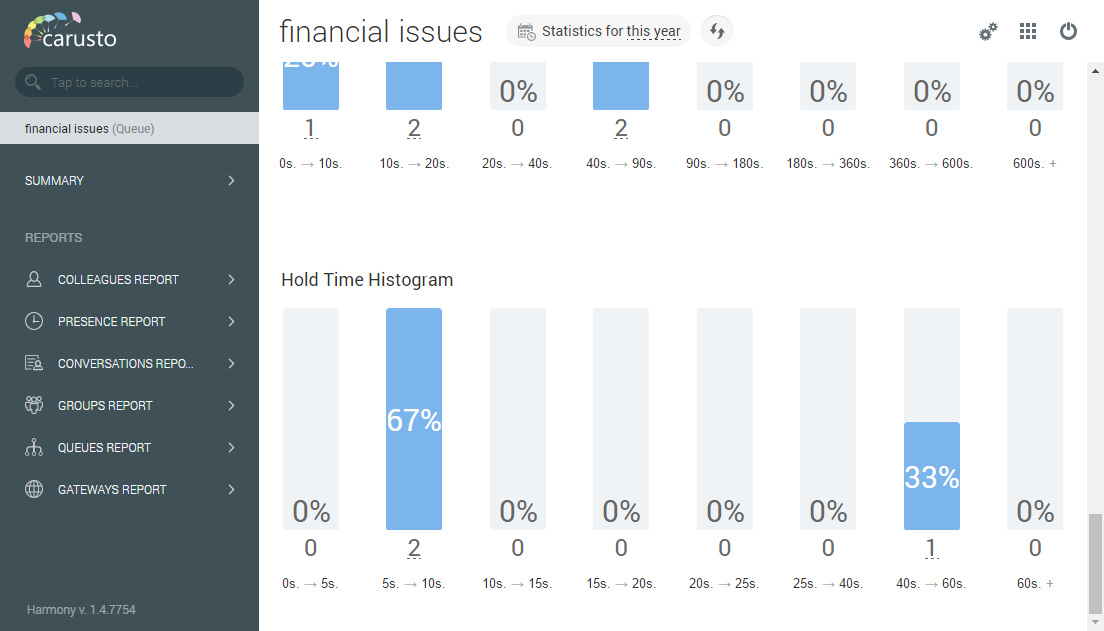
These histograms give an opportunity to analyze the work of queue agents. They show how much time the client spent for dialing to the agent, on hold waiting for the conversation and the duration of conversation. Clicking on the histogram interval opens a detailed report on the selected calls.

